When Will Coronavirous (COVID-19) End?
Frank Zheng / 2020-01-24
Coronavirus Disease 2019 (COVID-19) was identified as the cause of a cluster of pneumonia cases in Wuhan, a city in the Hubei Province of China, at the end of 2019. It subsequently spread throughout China and elsewhere, becoming a global health emergency. In February 2020, the World Health Organization (WHO) designated the disease COVID-19, which stands for coronavirus disease 2019.
This post will use current data with SIR model and (try to) forcast when the number of coronavirous infected patients reaches its peak and eventually declines.
SIR and SIRS Model
In 1927, the SIR model for sperad of disease was first propsed in in a collection of three articles in the Proceedings of the Royal Society by Anderson Gray McKendrick and William Ogilvy Kermack;the resulting theory is known as Kermack–McKendrick theory; now considered a subclass of a more general theory known as compartmental models in epidemiology. The three original articles were republished in 1991, in a special issue of the Bulletin of Mathematical Biology.
SIR model stands for a (suspectible - infectious - recovered) model, while SIRS represents a (suspectible - infectious - recovered - susceptible) model. The main difference between these two is the latter does not confer lifelong immunity, so individual may become susceptible again.
The SIR/SIRS diagram from IDM below shows how individuals move through each compartment in the model.
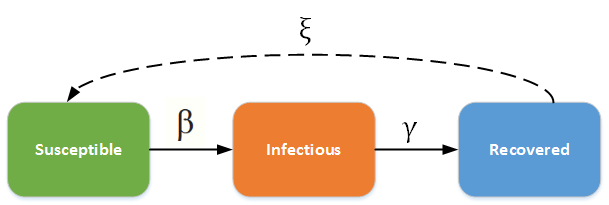
${\beta}$, the transmission rate, controls the rate of spread which represents the probability of transmitting disease between a susceptible and an infectious individual.$\gamma$= 1/D, recovery rate, is determined by the average duration, D, of infection.$\xi$, only used for the SIRS model, is the rate which recovered individuals return to the susceptible statue due to loss of immunity.
Besides the immunity issue, SIR model also considers the population changes. If the course of the infection is short (emergent outbreak) compared with the lifetime of an individual and the disease is non-fatal, vital dynamics (birth and death) can be ignored. SIR model with vital dynamics considers new births that can provide more susceptible individuals to the population, sustaining an epidemic or allowing new introductions to spread throughout the population. In our COVID-19 case, becuase the disease is such a outbreak, it’s not likely to be fatal (3.4% death rate reported by WHO), and most patients who recoved from conronavirus gain immunity, therefore, SIR model without vital dynamics is more situable.
In the deterministic form, the SIR model can be written as the following there ordinary differential equations (ODE), parameterized by two growth factors β and γ:
$$\frac{dS}{dt} = - \frac{\beta S I}{N}$$
$$\frac{dI}{dt} = \frac{\beta S I}{N} - \gamma I$$
$$\frac{dR}{dt} = \gamma I$$
where N is the population, and since each of S, I and R represent the number of people in mutually exclusive sets, we should have
$$S+I+R=N$$
Note that the right hand sides of the equations sum to zero, hence
$$\frac{dS}{dt} + \frac{dI}{dt} + \frac{dR}{dt} = \frac{dN}{dt}=0$$
which indicates that the population is constant.
In a closed population with no vital dynamics, an epidemic will eventually die out due to an insufficient number of susceptible individuals to sustain the disease. Infected individuals who are added later will not start another epidemic due to the lifelong immunity of the existing population.
A discrete model can be derived from the above equations for the evolution of the disease.
${S}_{n+1} = S_n − \frac{\beta}{N} S_n I_n$
${I}_{n+1} = I_n + \frac{\beta}{N} S_n I_n - \gamma I_n$
${R}_{n+1} = R_n + \gamma I_n$
- New infecteds,
$I_{n+1}$, result from contact between the susceptibles,$S_n$, and infecteds,$I_n$, with rate of infection$\frac{\beta}{N}$. - Infecteds are cured at a rate proportional to the number of infecteds,
$\gamma I_n$, which become recovered,$R_n$ - The term
$\frac{\beta}{N} S_n$represents the proportion of contacts by an infected individual that result in the infection of a susceptible individual. - The ratio
$1/\gamma$is the average length of the infectious period of the disease.
While these may look very confusing, once explained they make a lot of sense.
For example, ${S}_{n+1} = S_n − \frac{\beta}{N} S_n I_n$
the equation simply means that the number of susceptible people today(${S}_{n+1}$) would be the number of susceptible people yesterday $S_n$ deduct the number of people that got infected yesterday and today. We would calculate the number of people infected yesterday by multiplying by the rate of infection.
Similarly, ${I}_{n+1} = I_n + \frac{\beta}{N} S_n I_n - \gamma I_n$ this simply means that the number of people that number of people infected today would be the number of people that were infected yesterday plus the number of people that got infected yesterday and today, then deduct the number of people that recovered yesterday. The final number is the number of people in the infected category today.
Lastly, ${R}_{n+1} = R_n + \gamma I_n$ this equation simply means that the number of people recovered today are the number of people that were recovered yesterday as well as the number of infected people that recovered today.
This model is clearly not applicable to all possible epidemics: there may be births and deaths, people may be re-infected, and so on. More complex models take these and other factors into account. However, based on we’ve learnt from coronavirous so far, I believe the SIR model without vital dynamics is the simplist but adequate model to use.
Load packages
import numpy as np
import matplotlib.pyplot as plt
import math
Setup Parameters for SIR Model
Use current data to find ${\gamma}$ (recovery rate) and ${\beta}$ (transmission rate).
On 01/24/2020, Wuhan has 258 cumulative total confirmed cases, 25 recovered case and 60 new confirmed cases.
### based on the data until 01/24/2020 for Wuhan
# infected
inf = 233
# recovered
rec = 25
# recovery rate
gamma = 25.0/258
# transmission rate
beta = (60+25)/(258-25)
# population of Wuhan
n = 1100 * 10000
Build SIR Model
class SIR:
    def __init__(self, inff, recc, suss, time):
        self.inff = inff
        self.recc = recc
        self.suss = suss
        self.time = time

def sir(beta, gamma, n, inf, rec):
    sus = n - inf - rec
    t = 1
    inff = []
    recc = []
    suss = []

    time = []
    inff.append(inf)
    recc.append(rec)
    suss.append(sus)
    time.append(t)

    while True:
        if t > 200:
            break
        t += 1
        a = inf
        b = rec
        c = sus
        rec = b + gamma * a
        inf = (a + beta * a * c / n - gamma * a)
        sus = n - rec - inf

        inff.append(round(inf))
        recc.append(rec)
        suss.append(round(sus))
        time.append(t)
    return SIR(inff, recc, suss, time)
Plot results
p = sir(beta, gamma, n, inf, rec)
fig = plt.figure(figsize=(12,4))
plt.plot(p.time, p.suss, 'y-', label = 'Suspectible')
plt.plot(p.time, p.inff, 'r-', label = 'Infected')
plt.plot(p.time, p.recc, 'g-', label = 'Recovered')
plt.axvline(p.time[p.inff.index(max(p.inff))], ls = '--')
plt.title('SIR Model Prediction on COVID-19 in Wuhan \n with 01/24/2020 as Day 1')
plt.xlabel('Time(day) \n by Frank Zheng — frankzheng.me')
plt.ylabel('Population')
plt.xlim(0, 201)
plt.legend(loc = 'best')
plt.show()
Analysis
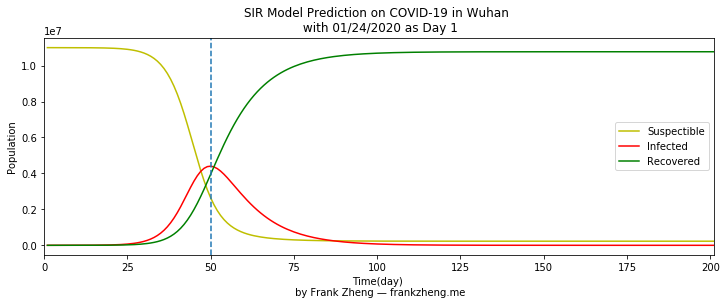
The SIR model considered 01/24/2020 the day Wuhan shutdown as day 1. So the number of infected patients reaches its peak 50 days after the city lockdown, 03/14/2020.
The yellow line (the number of people who have not yet been infected) starts to rapidly decline around the 25th day indicates the disease is very contagious, with pretty much every susceptible person being infected by day 75. The line for a less infectious disease would slope more gently to the right.
The red line (the daily number of infected people) is essentially the epi-curve for the disease. It also changes rapidly to its maximum on day 50, and then falls slowly until about day 100 when nearly everyone has recovered. The reason that the increase of infected people stops at day 50 and then falls is that by then almost every susceptible person has been infected. Where the yellow and red lines cross at about day 45, is the first day when more people are in the infected category than the susceptible one.
The green line (the number of people who recoverd), initially increases slowly, then steadily increases, and eventually leveling off near day 100. The day when more people recover than are susceptible is where the yellow and green lines cross at about day 48. Where the green and red lines cross at about day 51 is when recovered people outnumber infected ones.